Bitcoin is staring down the $105,000 wall -- and the smart money is already flinching. As February 5 approaches, Polymarket traders are pricing in a coin-flip: just 56% odds that BTC clears this level. That tepid confidence tells you everything about where the real tension lies.
- Long-term holders are dumping at an accelerating pace, a historically reliable bearish signal
- Institutional ETF inflows of +$754M provide a bullish counterweight but may not be enough
- The $84,000 support level is the line in the sand -- break it, and $70,000 comes fast
Bitcoin Price Analysis: Current Trading Levels
Think of Bitcoin's current market structure like a tug-of-war between two very different crowds. On one side, the "diamond hands" -- long-term holders who weathered every crash since 2022 -- are quietly heading for the exits. Their selling has ramped up significantly, and when these historically patient holders start taking profits, it tends to mean something.
On the other side, institutions are writing checks. Recent ETF inflows hit +$754M, the biggest wave of institutional money in three months. It's the financial equivalent of one team's fans leaving the stadium while a fresh busload arrives from the other side.
Technical Indicators & Bitcoin Performance
The numbers tell a story the headlines miss:
| Indicator | Current Status | Signal |
|---|---|---|
| Support Level | $84,000 | Critical downside support |
| Resistance Level | $105,000 | Primary upside barrier |
| Long-Term Holder Selling | Increasing | Bearish pressure |
| Whale Exchange Deposits | Rising | Distribution signal |
| ETF Inflows | +$754M (recent) | Bullish institutional demand |
That rising whale deposit figure is the one that should worry you most. When big holders start moving Bitcoin from cold storage to exchanges, it historically precedes a selloff within 1-2 weeks.
Analysis
Here's the core problem for bulls: the $105,000 level isn't just a number on a chart. It's a brick wall that Bitcoin has bounced off before. Breaking through major resistance requires momentum, and momentum is exactly what long-term holder selling drains from a market. Picture trying to push a boulder uphill while someone pours sand under your feet.
If you're betting on a breakout, the institutional ETF story is your best case. That $754M inflow is real money with real conviction behind it. But historically, when long-term holders accelerate selling, the resulting consolidation phase lasts 2-4 weeks -- which puts February 5 right in the danger zone.
Bitcoin dominance sits at 59.2%, confirming BTC is still leading the broader market cycle. But leadership doesn't guarantee direction. The $84,000 support level is the trapdoor -- a break below could trigger cascading liquidations toward $70,000.
FAQ
What is the Bitcoin price prediction for February 5, 2026?
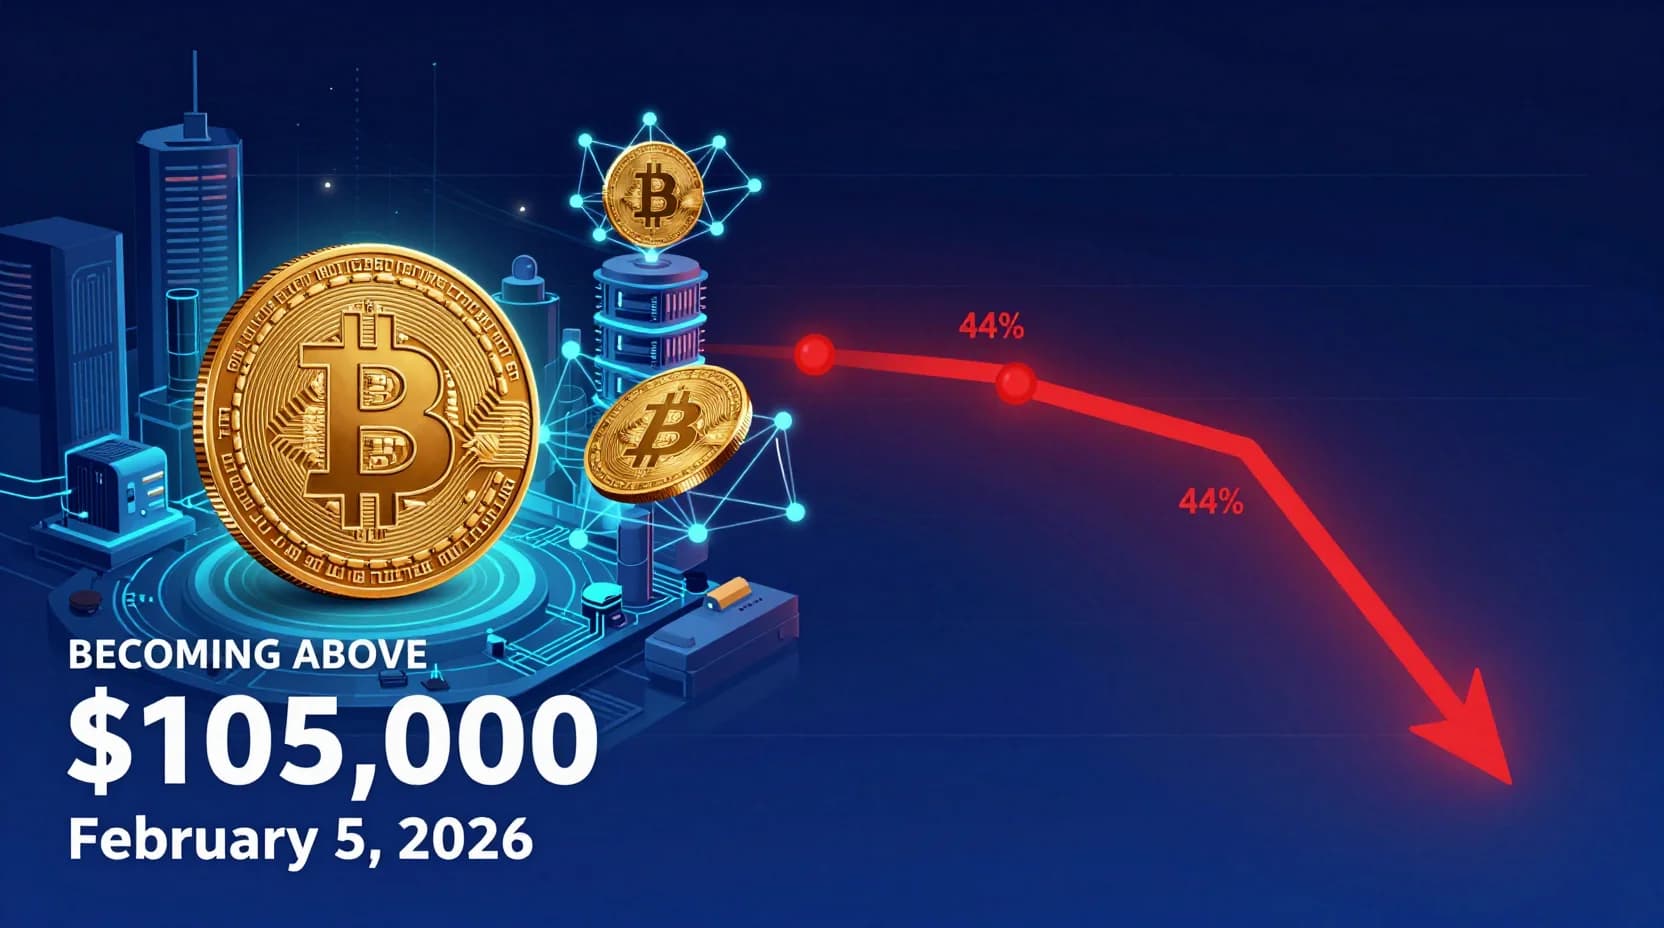
Our analysis assigns a 44% probability that Bitcoin trades above $105,000 on February 5, 2026. The bearish lean is driven by accelerating long-term holder selling and rising whale exchange deposits, both historically reliable distribution signals.
Will Bitcoin recover above $100,000 in Q1 2026?
The institutional ETF inflow trend ($754M recently) supports the case for eventual recovery above $100,000. However, the current on-chain data suggests a consolidation phase of 2-4 weeks before any sustained breakout attempt.
Prediction
Direction: Bearish | Probability: 44% | Horizon: 1 day (February 5, 2026) Answer: No
The on-chain evidence is stacking up against a breakout. Accelerating long-term holder selling, rising whale deposits, and stubborn resistance at $105,000 collectively paint a picture of distribution, not accumulation. The 56% Polymarket odds look generous given the weight of bearish signals -- our independent read puts the real probability closer to 44%.
How to Trade This
This prediction trades on Polymarket. Buy "Yes" shares if you think BTC clears $105K, or "No" shares if you agree with our bearish read. Each share pays $1 if correct, $0 if wrong. Sell anytime before resolution. Risk: Only trade what you can afford to lose.