Long-term Bitcoin holders are selling at the fastest pace in months, whale deposits to exchanges are spiking, and the smart money appears to be heading for the exits -- all while retail traders are still dreaming about $105,000. That disconnect between who's buying and who's selling is the story nobody's talking about.
Bitcoin Price Analysis: Current Trading Levels
Bitcoin hasn't cracked $105,000, and the path there looks more like an obstacle course than an open highway. The $100,000 psychological barrier alone is a gravitational force -- every time BTC approaches six figures, profit-taking kicks in like clockwork. Getting past that level and then adding another $5,000 in two days? That's asking a lot from a market where the biggest holders are actively distributing.
What's particularly telling is the behavior of long-term holders. These aren't panic sellers or day traders getting shaken out. These are wallets that have held Bitcoin through multiple cycles, and they're choosing now to take chips off the table. When the people who've seen everything decide it's time to sell, you should pay attention.
Technical Indicators & Bitcoin Performance
The technical picture reads like a warning label. Whale exchange deposits are climbing -- a pattern that historically precedes local tops, not breakouts. Pair that with accelerating long-term holder distribution, and you've got two of the most reliable bearish signals flashing simultaneously.
| Indicator | Current Status | Signal |
|---|---|---|
| Long-term Holder Selling | Accelerating | Bearish |
| Whale Exchange Deposits | Rising | Bearish |
| Market Sentiment | Cautiously Optimistic | Neutral |
| Support Level | $84,000 | Key Support |
The one counterweight? Sentiment remains cautiously optimistic. But sentiment is a lagging indicator -- it tells you what people feel, not what the data says is coming.
Key Factors Driving Bitcoin Price Movement
On the bull side, institutional flows haven't dried up. ETF inflows continue to provide a steady bid underneath the market, and traditional finance keeps expanding its crypto footprint. That's the floor under this market, and it's real.
But here's the problem: a floor is not a catalyst. Institutional buying provides support; it doesn't generate the kind of explosive momentum needed to punch through $100K resistance and tack on another 5% in 48 hours. For that, you'd need a major narrative shift -- a surprise rate cut, a massive ETF approval, or some other catalyst that isn't currently on the calendar.
The downside scenario is clearer. If selling pressure persists, $84,000 becomes the next stop. That level has held in previous pullbacks and represents the kind of deep support where buyers historically step in. The gap between here and there is not small -- and if you're positioned for $105,000 by Wednesday, you need to consider whether you're betting on hope or data.
Bitcoin Price Prediction: February 5, 2026 Forecast
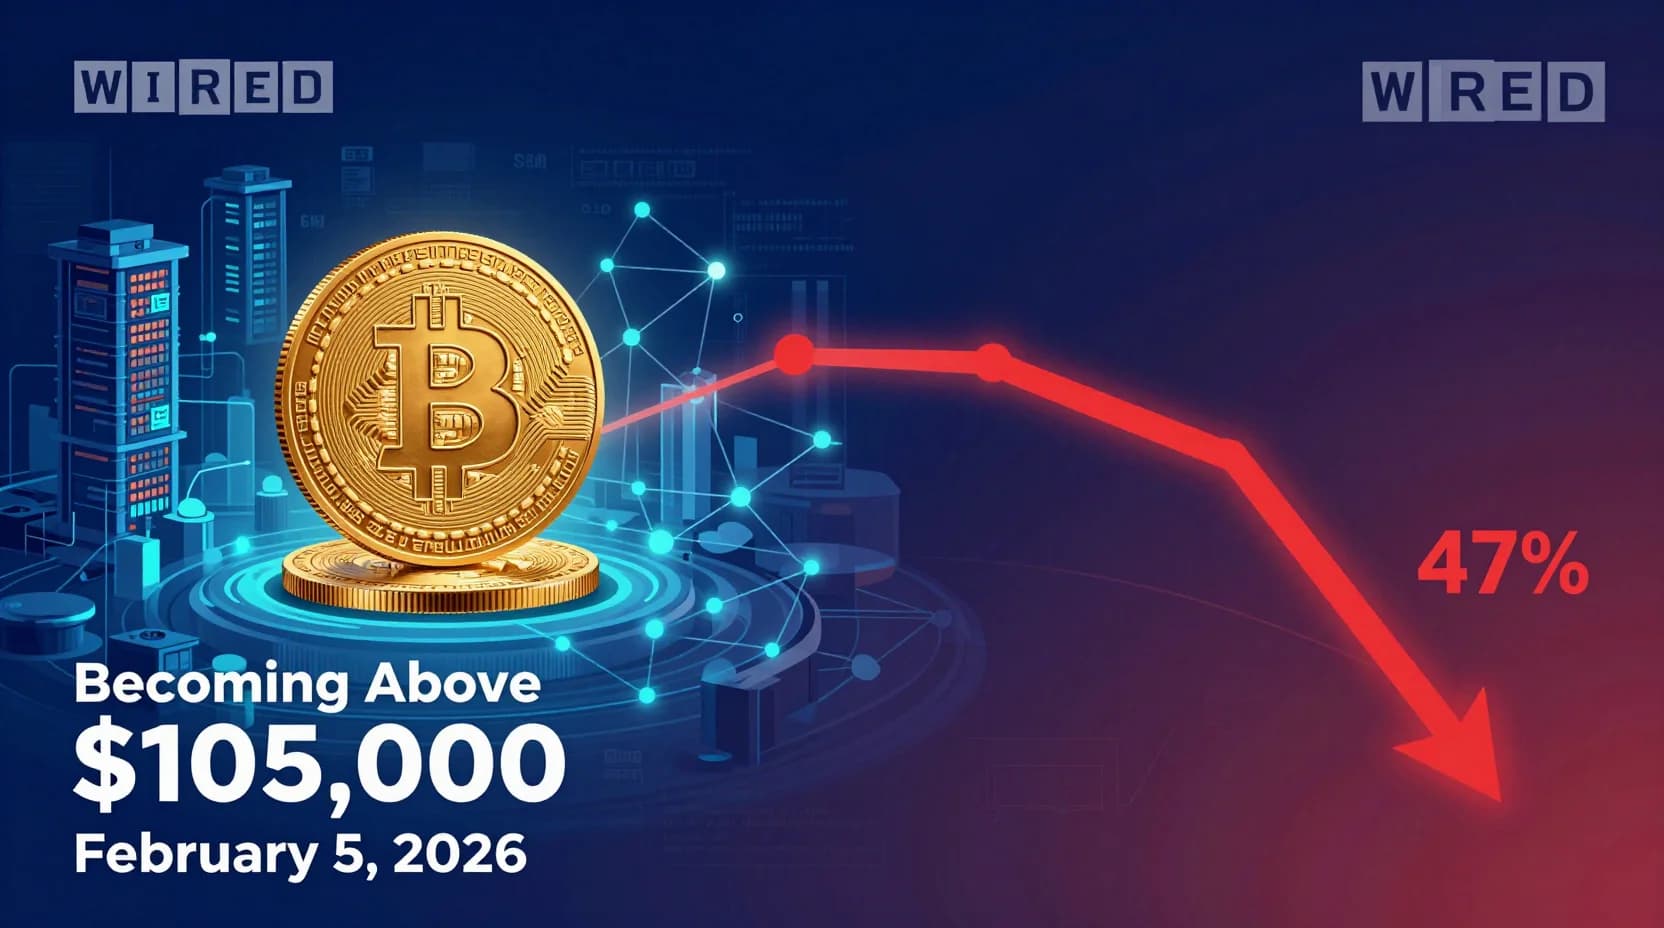
Direction: Bearish | Probability: 47% | Horizon: 2 days (February 5, 2026) Answer: No
The math doesn't favor the bulls on this timeline. A 47% probability of clearing $105,000 by February 5 reflects the tension between persistent institutional demand and aggressive distribution from the wallets that matter most. Long-term holders aren't selling because they're scared -- they're selling because they think current prices represent good value to exit. When smart money disagrees with the crowd, the smart money usually wins. The longer-term Bitcoin thesis remains intact, but the next 48 hours favor consolidation or a pullback over a fresh breakout.