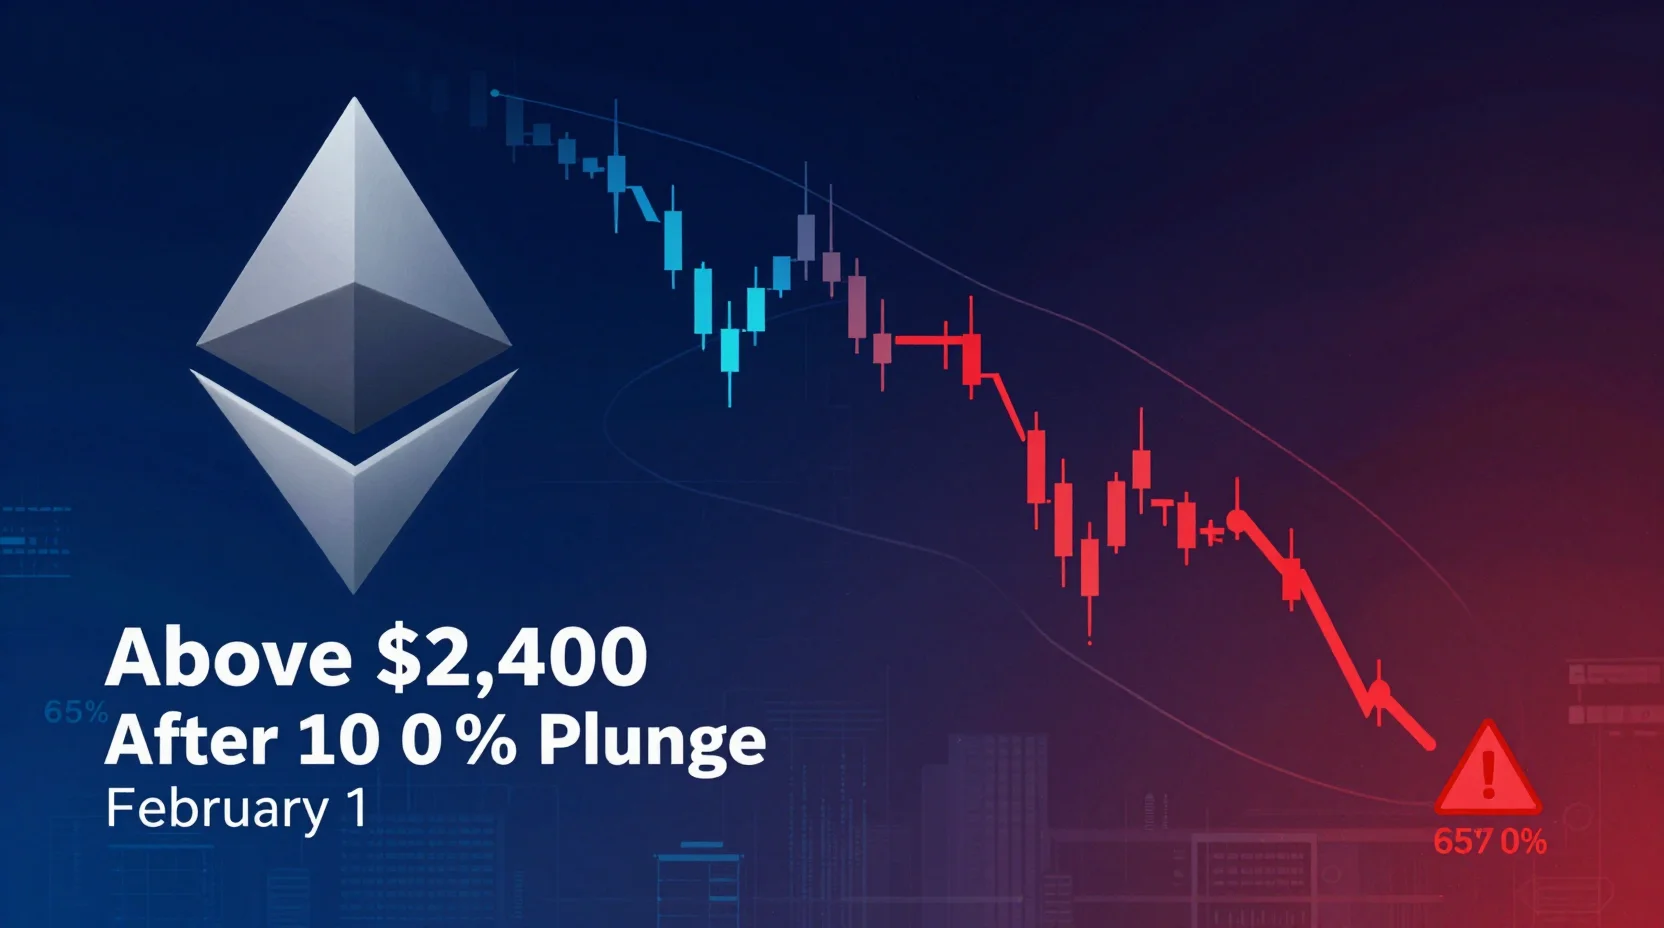
Ethereum just had the kind of day that turns long-term holders into nervous wrecks. A 10.85% single-day crash wiped out over $1.15 billion in ETH positions and sent the price skidding to $2,399.92 -- right at the edge of a critical support level that, if it breaks, opens the door to $2,100.
- ETH plunged 10.85% in a single day, liquidating $1.15 billion in leveraged positions
- RSI sits at 34.69 -- technically oversold, but the liquidation cascade may not be finished
- One individual trader lost $220 million in the crash, signaling extreme leverage in the system
Current Situation
The numbers from this sell-off are staggering. Total crypto market liquidations hit $2.5 billion, with Ethereum absorbing the worst of the damage. One unlucky -- or perhaps reckless -- trader watched $220 million evaporate in a single position. That is not a bad day at the office. That is a financial extinction event.
What makes this particularly concerning is the mechanism behind the decline. Forced liquidations trigger a cascade: one margin call triggers a sell, which drops the price, which triggers more margin calls, which triggers more sells. It is a financial avalanche, and the $1.15 billion in wiped ETH positions suggests the avalanche may still be rolling downhill. Weak ETF flows are not helping either -- institutional demand that might absorb selling pressure simply is not there.
Technical Analysis
| Indicator | Value | Signal |
|---|---|---|
| Current Price | $2,399.92 | Support Level |
| RSI (14) | 34.69 | Oversold |
| Daily Change | -10.85% | Strong Bearish |
| Key Support | $2,690 | Holding |
| Critical Support | $2,100 | Next Level |
| Resistance | $3,100-$3,800 | Multi-year Downtrend |
That RSI reading of 34.69 is worth paying attention to. Historically, readings below 30 tend to precede bounces as panic selling exhausts itself. But here is the catch -- you are not below 30 yet, and the liquidation pressure could push ETH deeper into oversold territory before any relief arrives.
Analysis
The bull case and the bear case are fighting over the same data point: oversold conditions.
Bulls will tell you that an RSI of 34.69 means the selling is overdone. Changelly forecasts a 2.81% bounce to $2,811.13 by February 2. CoinCodex projects a potential high of $3,118.03, representing 14.37% upside. MEXC analysts see recovery to the $3,200-$3,400 range if the $2,400 support holds.
Bears will counter that oversold can get more oversold, especially when $1.15 billion in liquidations just ripped through the market. The $2,690 support level is the line in the sand -- if that fails, the next meaningful floor sits all the way down at $2,100. That is another 12.5% drawdown from current levels. And with ETF flows weak and institutional appetite lukewarm, who exactly is buying the dip at scale?
The honest read? Both sides have a point, but the weight of evidence leans bearish in the near term. Liquidation cascades do not typically resolve in a single day. The forced selling creates a sentiment overhang that takes time to clear, even when technical indicators scream "oversold."
FAQ
Will Ethereum recover after the 10% crash?
Analyst forecasts range from a modest 2.81% bounce (Changelly) to a potential 14.37% rally to $3,118 (CoinCodex). Recovery depends heavily on whether the $2,400 support level holds and whether the liquidation cascade has fully played out. Weak ETF flows remain a headwind for any sustained recovery.
What caused the Ethereum price crash?
The 10.85% decline was driven by cascading liquidations totaling $1.15 billion in ETH positions, part of a broader $2.5 billion crypto market wipeout. Forced selling triggered a chain reaction of margin calls, amplifying the downturn beyond what organic selling pressure alone would produce.
Prediction
Direction: Bearish | Probability: 65% | Horizon: 1 day (February 1, 2026) Answer: No
The math favors continued downside pressure. When $1.15 billion in ETH positions get liquidated in a single day, the selling rarely stops on a dime. Oversold RSI readings at 34.69 offer a glimmer of hope for a bounce, but the sheer scale of forced selling -- combined with weak institutional demand through ETF products -- suggests the path of least resistance points lower. If $2,400 breaks, $2,100 becomes the next battleground.